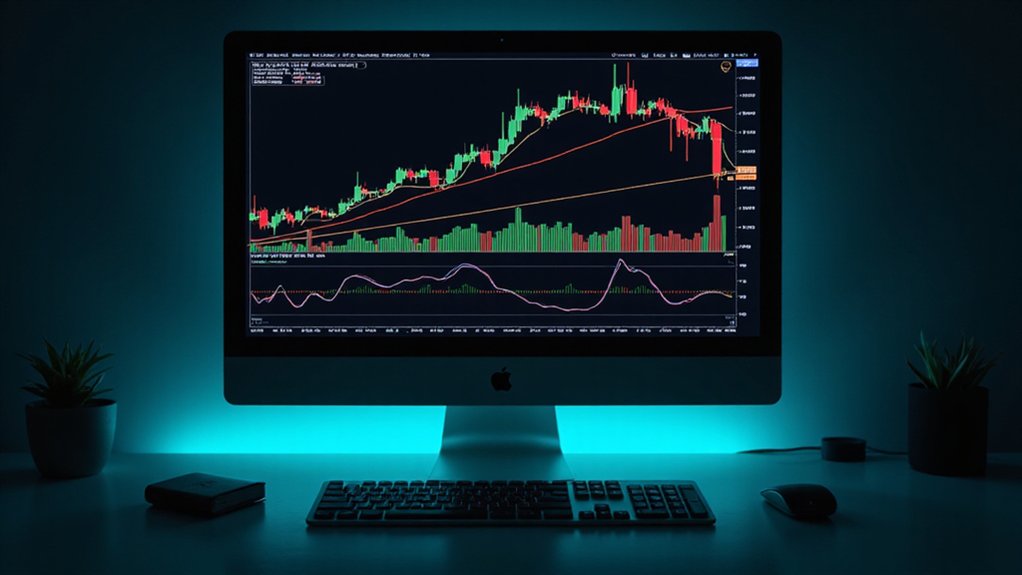
Reading cryptocurrency charts requires familiarity with several key elements. Candlestick patterns reveal market sentiment through color-coded bodies and wicks, while technical indicators like RSI and MACD transform raw price data into actionable insights. Volume analysis confirms pattern validity—a step novices often overlook. Successful traders examine multiple timeframes simultaneously, as five-minute charts might suggest collapse while daily charts reveal mere consolidation. Proper risk management transforms this analytical puzzle from speculative gambling into calculated strategy.

Why does a seemingly random assortment of lines, colors, and shapes hold such power over the fortunes of crypto investors worldwide? The answer lies in understanding the cryptic visual language of trading charts—an essential literacy for anyone venturing into digital asset markets where volatility reigns supreme and fortunes change hands with alarming regularity.
The foundation of chart analysis begins with selecting the appropriate visualization method.
Line charts, with their elegant simplicity, track closing prices across time; bar charts offer more detail by displaying opening, closing, high, and low prices; while candlestick charts—the preferred weapon in most traders’ arsenals—use color-coded bodies and protruding wicks to communicate market sentiment at a glance. Candlesticks reveal whether price action was positive or negative during the selected timeframe, providing crucial information for trading decisions. Each candlestick contains price movement data that shows the highest and lowest points reached during the trading period, offering deeper insights into market behavior.
These green and red soldiers marching across screens worldwide tell stories of triumph and capitulation, where a single “hammer” pattern might presage a dramatic market reversal.
Chart patterns emerge as traders’ collective psychology manifests in price action.
The ominous head and shoulders formation signals impending trend exhaustion, while cup and handle patterns suggest accumulation before potential breakouts.
These visual narratives, combined with horizontal support and resistance levels (where price historically struggles to breach), create a roadmap of possible future scenarios—though one that frequently mocks those who follow it too confidently.
Technical indicators supplement this visual analysis by transforming price data into mathematical insights.
Moving averages smooth market noise, RSI detects overbought and oversold conditions, and MACD highlights momentum shifts. Triangle patterns can form over varying timeframes, indicating potential continuation or reversal depending on their specific configuration.
Volume—often overlooked by novices—provides vital confirmation of pattern validity, as significant price movements without corresponding volume often dissolve into false breakouts.
The timeframe selected dramatically alters interpretation: five-minute candles might suggest apocalyptic collapse while daily charts reveal mere consolidation.
Successful traders typically employ multi-timeframe analysis, aligning shorter-term entries with longer-term trends.
Ultimately, chart reading remains as much art as science—where risk management through prudent stop-losses and position sizing separates survivors from casualties in a market notorious for punishing both ignorance and overconfidence with equal severity.
Frequently Asked Questions
What Is the Best Timeframe for Cryptocurrency Chart Analysis?
The ideal timeframe for crypto chart analysis isn’t universal—it’s contingent upon one’s trading strategy and risk tolerance.
Short-term frames (1m-15m) suit scalpers capturing volatility but demand constant vigilance.
Medium-term charts (30m-4h) offer swing traders clearer trend identification with reduced noise.
Long-term timeframes provide position traders stability by filtering false signals.
Most professionals employ multi-timeframe analysis (1:4 or 1:6 ratios), using longer frames for trend confirmation and shorter intervals for tactical entries.
How Accurate Are Cryptocurrency Price Predictions Using Technical Analysis?
Technical analysis offers cryptocurrency traders a framework for prediction rather than a crystal ball.
Studies suggest accuracy rates from 50-90%, with efficacy fluctuating wildly based on market volatility and methodology.
Machine learning integration has improved results, particularly for buy/sell signals.
Nevertheless, cryptocurrency’s inherent volatility renders even sophisticated technical analysis susceptible to false signals—a humbling reality for those who mistake pattern recognition for prophecy in these digital markets.
Which Chart Patterns Are Most Reliable for Cryptocurrency Trading?
In cryptocurrency markets, where volatility reigns supreme, certain chart patterns emerge as relatively more trustworthy navigational tools.
The Head and Shoulders pattern (particularly its inverse variant), Channel patterns, and Bullish/Bearish Flags typically exhibit higher reliability—especially when observed on longer timeframes with substantial volume confirmation.
Double Bottoms with increasing volume often portend meaningful trend reversals, while Cup and Handle formations can presage significant upward movements (when patience allows their complete formation).
Can Candlestick Patterns Predict Cryptocurrency Market Crashes?
Candlestick patterns offer intriguing signals but cannot definitively predict cryptocurrency market crashes.
While formations like evening stars and bearish engulfing patterns may indicate potential downturns, crypto’s notorious volatility often renders traditional technical analysis less reliable.
These patterns become marginally more useful when combined with volume indicators, on-chain metrics, and broader market context—though even then, the crypto market’s susceptibility to manipulation and exogenous shocks limits their predictive power considerably.
How Do Trading Volumes Impact Cryptocurrency Price Movements?
Trading volumes serve as vital barometers of market sentiment in cryptocurrency ecosystems.
High volumes accompanying price movements typically validate trend strength—upward trajectories with robust participation suggest sustainable bullish momentum, while volume spikes during downtrends often signal capitulation.
Conversely, price shifts occurring on anemic volumes warrant skepticism regarding their durability.
Volume analysis also reveals potential manipulation; artificially inflated metrics (sadly common in unregulated markets) mislead traders about genuine interest and liquidity conditions.


