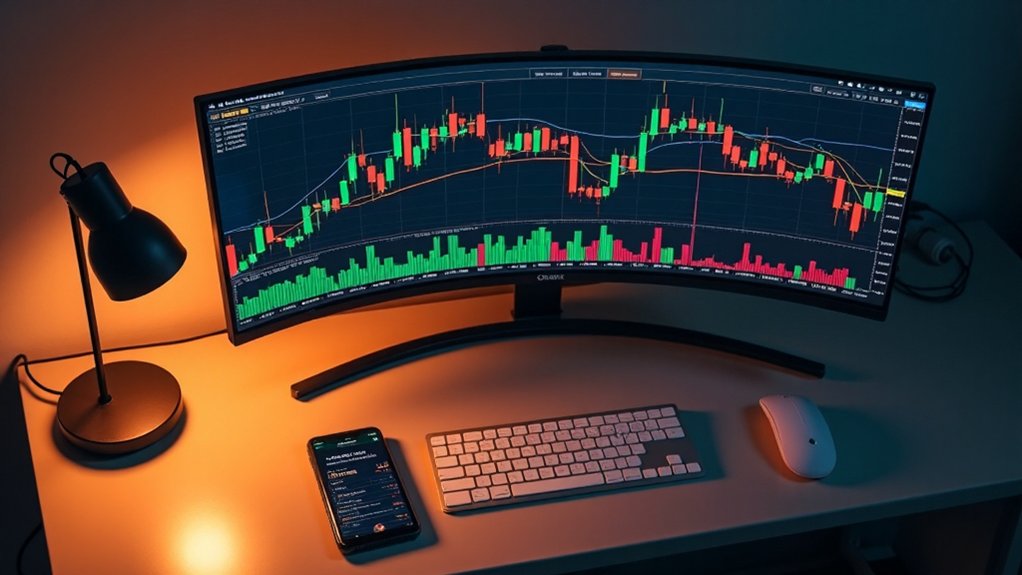

Candlestick charts encode market psychology with remarkable efficiency. The rectangular body displays the gap between opening and closing prices, while protruding wicks (shadows) reveal price extremes. Green/white bodies signal bullish sentiment (closing higher than opening); red/black indicates bearish pressure. Long bodies suggest conviction; diminutive ones reflect indecision. Elongated shadows often portend potential reversals. Common formations—engulfing patterns, doji stars, three black crows—offer sophisticated signals for traders willing to decode their visual language.
The art of reading candlesticks—those ubiquitous rectangular charts with their protruding wicks—represents perhaps the most visually intuitive method for decoding market psychology.
Candlestick charts transform abstract market sentiment into visual cues, revealing psychology behind every price movement.
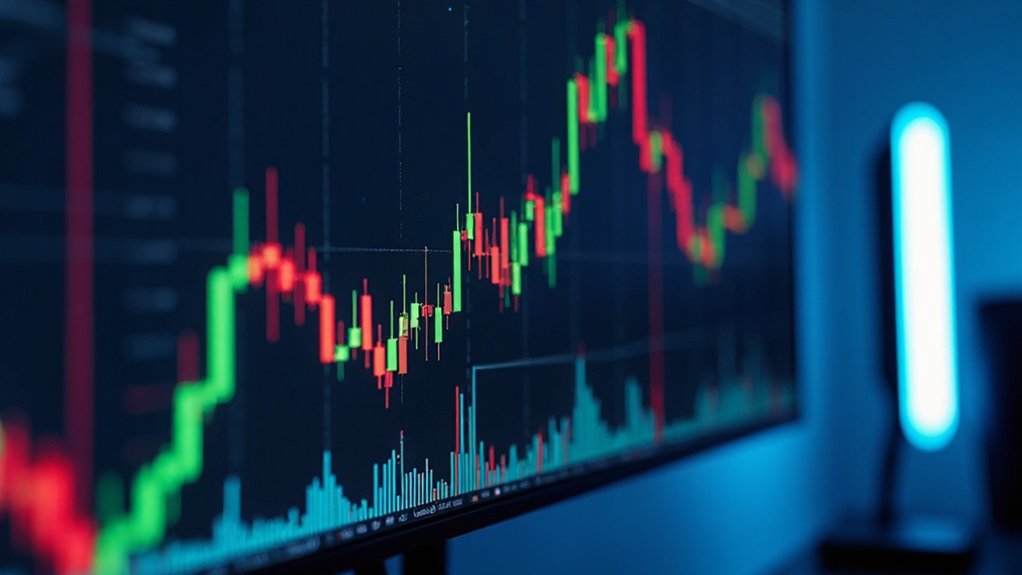
Each component tells a story: the body (that rectangular centerpiece) displays the differential between opening and closing prices, while the upper and lower shadows—financial parlance for those protruding lines—reveal the day’s price extremes.
The color coding simplifies interpretation; green or white bodies signal bullish momentum (closing higher than opening), while their red or black counterparts indicate bearish pressure.
The body length speaks volumes about conviction.
Long green bodies suggest strong buying pressure, whereas diminutive bodies—regardless of hue—indicate market indecision.
The shadows, meanwhile, offer insights into intraday volatility; elongated wicks often portend potential reversals as they demonstrate rejected price levels.
In crypto markets, which operate 24 hours a day, candlestick timeframes determine what constitutes open and close prices.
(One might wonder: what market folly drives those brief, ultimately abandoned excursions to extreme prices?)
Pattern recognition separates novices from veterans.
Bullish engulfing patterns—where a robust green candle completely overshadows its preceding red counterpart—often herald upward reversals.
Conversely, three consecutive bearish candles (the ominously named “three black crows”) typically forecast continued downward momentum.
Morning stars and evening stars, those three-candle formations featuring a small middle candle, frequently mark major trend reversals.
Doji candlesticks—where opening and closing prices are virtually identical, creating a cross-like appearance—warrant particular attention.
These symbols of market equilibrium often precede significant directional changes, especially when appearing after extended trends.
Similarly, hammer formations (small bodies with long lower shadows) suggest potential buying interest after downtrends.
Ultimately, candlestick analysis transcends mere pattern recognition; it reveals market psychology at work.
Those elongated shadows? Failed attempts by bulls or bears to maintain momentum.
Engulfing patterns? The overwhelming of one sentiment by another.
Abandoned baby patterns? Market capitulation and sentiment reversal.
The astute trader recognizes these visual cues not as mere shapes, but as crystallized representations of collective human emotion—fear, greed, indecision, and conviction—playing out in financial markets.
Understanding candlestick patterns helps traders identify support and resistance levels that are crucial for determining optimal entry and exit points in the volatile cryptocurrency market.
Frequently Asked Questions
What Software Is Best for Candlestick Chart Analysis?
TrendSpider emerges as the premier candlestick analysis platform, offering automated detection of 150+ patterns and robust backtesting capabilities—albeit at a premium ($53.50-$223.50 monthly).
Budget-conscious traders might prefer TradingView’s impressive free tier with 39 patterns.
The best choice ultimately depends on one’s specific requirements: day traders benefit from TrendSpider‘s real-time alerts, while crypto enthusiasts may find StockCharts’ specialized coverage more valuable.
MetaStock’s educational components serve novices particularly well.
How Do Candlesticks Differ From Bar Charts?
Candlesticks and bar charts both display OHLC data, but their visual execution creates distinct analytical experiences.
Candlesticks employ color-coded “real bodies” (green/white for bullish, red/black for bearish) with extended wicks, prioritizing open-close relationships and intra-period sentiment shifts.
Bar charts, with their minimalist vertical lines and horizontal ticks, emphasize period-to-period price continuity.
While both serve similar functions, candlesticks‘ intuitive visual language makes pattern recognition substantially more accessible for time-pressured traders.
Can Candlestick Patterns Predict Market Crashes?
Candlestick patterns alone cannot predict market crashes, though they offer intriguing warning signs when properly contextualized.
Bearish formations like evening stars, three black crows, and dark cloud cover may signal reversals, but require confirmation from volume, trendlines, and broader market indicators.
Historical crashes often featured clusters of bearish patterns beforehand, yet the relationship remains correlative rather than causative—a sobering reminder that markets rarely telegraph their most dramatic moves with technical precision.
How Much Historical Data Should I Analyze?
The ideal historical dataset varies with one’s trading horizon—short-term traders typically examine 1-4 weeks of candlestick data, while long-term investors might require months or years.
This temporal decision isn’t arbitrary; it must align with strategic objectives and pattern recognition requirements.
While more data theoretically offers statistical robustness, excessive historical baggage can obscure recent, more relevant market dynamics.
The prudent analyst balances historical context against contemporary relevance.
Are Candlesticks Reliable in All Market Conditions?
Candlesticks aren’t universally reliable across all market conditions—a notion that would be comforting but ultimately misguided.
Their efficacy fluctuates considerably with market volatility, time frames, and trading environments.
While patterns like engulfing candles perform admirably near support/resistance levels, they can generate misleading signals during choppy markets or extreme volatility.
Prudent traders enhance reliability by combining candlestick analysis with other technical indicators and adjusting interpretations to accommodate prevailing market psychology.